নোট
এই পেজটি docs/tutorials/11_time_series.ipynb থেকে তৈরি হয়েছে।
পুঁজিবাজার কালীন-সারি (টাইম-সিরিজ) সংক্রান্ত তথ্য লোডিং এবং প্রক্রিয়াকরণ#
ভূমিকা#
ব্যবস্থাপনাবিদ্যায় অনেকগুলো সমস্যার মধ্যে, একটি হলো কালীন সারি (টাইম সিরিজ)। এখানে আমরা দেখব কীভাবে ছদ্ম-দৈবচয়নের মাধ্যমে (স্যুডো র্যান্ডম) কালীন সারি তৈরি, কিছু সংখ্যক প্রচলিত উৎস থেকে প্রকৃত পুঁজিবাজারের কালীন সারি উপাত্ত সংগ্রহ এবং এর সাদৃশ্য নিরূপণ করা হয়।
[1]:
%matplotlib inline
from qiskit_finance import QiskitFinanceError
from qiskit_finance.data_providers import *
import datetime
import matplotlib.pyplot as plt
from pandas.plotting import register_matplotlib_converters

register_matplotlib_converters()
[2]:
data = RandomDataProvider(
    tickers=["TICKER1", "TICKER2"],
    start=datetime.datetime(2016, 1, 1),
    end=datetime.datetime(2016, 1, 30),
    seed=1,
)
data.run()
Once the data are loaded, you can run a variety of algorithms on those to aggregate the data. Notably, you can compute the covariance matrix or a variant, which would consider alternative time-series similarity measures based on dynamic time warping (DTW). In DTW, changes that vary in speed, e.g., one stock’s price following another stock’s price with a small delay, can be accommodated.
[3]:
means = data.get_mean_vector()
print("Means:")
print(means)
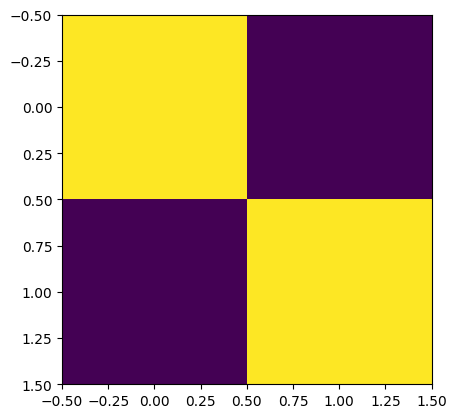
rho = data.get_similarity_matrix()
print("A time-series similarity measure:")
print(rho)
plt.imshow(rho)
plt.show()
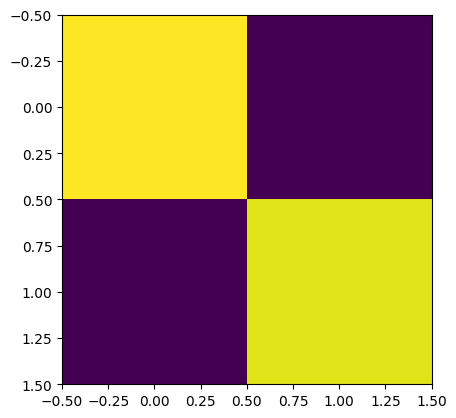
cov = data.get_covariance_matrix()
print("A covariance matrix:")
print(cov)
plt.imshow(cov)
plt.show()
Means:
[33.97683271 97.61130683]
A time-series similarity measure:
[[1.00000000e+00 5.41888011e-04]
 [5.41888011e-04 1.00000000e+00]]
A covariance matrix:
[[2.08413157 0.20842107]
 [0.20842107 1.99542187]]
যদি তুমি চাও, তুমি ছদ্ম-দৈবচয়নের ভিত্তিস্বরূপের মধ্যে দেখতে পারো। দয়া করে মনে রাখবে যে, ব্যক্তিগত শ্রেণী সদস্যগুলো (আন্ডারস্কোর দিয়ে শুরুকৃত) Qiskit-এর ভবিষ্যৎ রিলিজ বা প্রকাশে পরিবর্তন হতে পারে।
[4]:
print("The underlying evolution of stock prices:")
for (cnt, s) in enumerate(data._tickers):
    plt.plot(data._data[cnt], label=s)
plt.legend()
plt.xticks(rotation=90)
plt.show()

for (cnt, s) in enumerate(data._tickers):
    print(s)
    print(data._data[cnt])
The underlying evolution of stock prices:
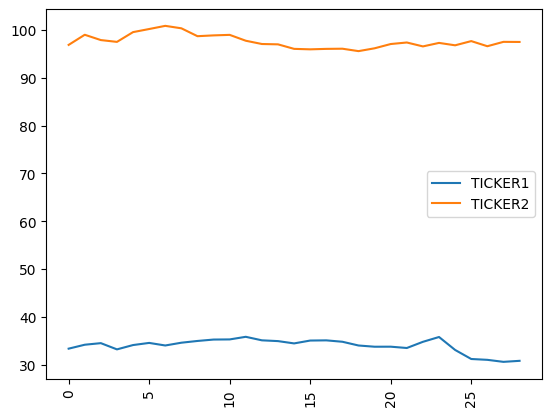
TICKER1
[33.345584192064784, 34.167202335565946, 34.49763941174933, 33.19448218014497, 34.099838046818086, 34.5462126191821, 34.009259383821814, 34.59037748801817, 34.95494988420424, 35.24908238085977, 35.27750462217556, 35.82421760878801, 35.08776352178634, 34.92485357379329, 34.442734261113316, 35.04158047374794, 35.0813025812296, 34.78884583026451, 34.00693736790767, 33.7497451272888, 33.757887307807145, 33.48228440250777, 34.77634821690598, 35.783072532211776, 33.07191005324581, 31.182896807278134, 31.008124715222973, 30.585934303646617, 30.799577301145227]
TICKER2
[96.8774156647853, 98.99525441983634, 97.88323365714406, 97.50562865001707, 99.5484002575094, 100.19510325371124, 100.85816662608751, 100.34416025440004, 98.69608508354439, 98.86354982776713, 98.97256391558868, 97.7452118613441, 97.06198519956354, 96.98994151983632, 96.04518989677554, 95.94691992892332, 96.04240295639278, 96.07798919344826, 95.57169753513395, 96.16544560691977, 97.0566125612021, 97.37746086576867, 96.55923063837835, 97.29088292216379, 96.78944290369674, 97.66860352198472, 96.59681610510728, 97.51128330823606, 97.49121985362058]
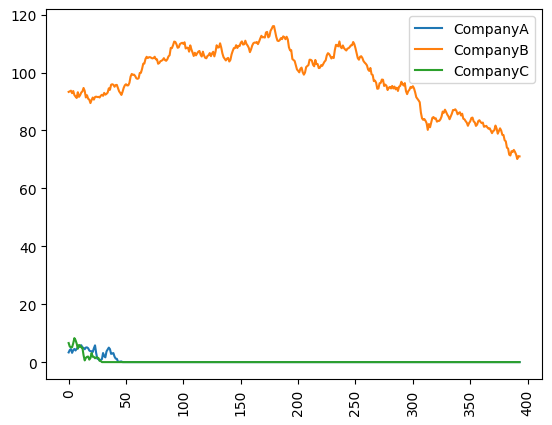
পরিষ্কারভাবে, তুমি ঘড়ির সংখ্যা এবং নাম, এবং তারিখের পরিসর মানিয়ে নিতে পারবে।
[5]:
data = RandomDataProvider(
    tickers=["CompanyA", "CompanyB", "CompanyC"],
    start=datetime.datetime(2015, 1, 1),
    end=datetime.datetime(2016, 1, 30),
    seed=1,
)
data.run()
for (cnt, s) in enumerate(data._tickers):
    plt.plot(data._data[cnt], label=s)
plt.legend()
plt.xticks(rotation=90)
plt.show()
কালীন সারির বন্ধকৃত মূল্যে প্রবেশ।#
While the access to real-time data usually requires a payment, it is possible to access historical (adjusted) closing prices via Wikipedia and Nasdaq Data Link free of charge, following registration at: https://data.nasdaq.com/sign-up In the code below, one needs to specify actual tickers of actual NASDAQ issues and the access token you obtain from Nasdaq Data Link; by running the code below, you agree to the Nasdaq Data Link terms and conditions, including a liability waiver. Notice that at least two tickers are required for the computation of covariance and time-series matrices, but hundreds of tickers may go beyond the fair usage limits of Nasdaq Data Link.
[6]:
stocks = ["GOOG", "AAPL"]

token = "REPLACE-ME"
if token != "REPLACE-ME":
    try:
        wiki = WikipediaDataProvider(
            token=token,
            tickers=stocks,
            start=datetime.datetime(2016, 1, 1),
            end=datetime.datetime(2016, 1, 30),
        )
        wiki.run()
    except QiskitFinanceError as ex:
        print(ex)
        print("Error retrieving data.")
একবার তথ্য লোড হয়ে গেলে, আপনি আবার কোভ্যারিয়েন্স ম্যাট্রিক্স বা এর DTW ভ্যারিয়েন্ট গণনা করতে পারেন।
[7]:
if token != "REPLACE-ME":
    if wiki._data:
        if wiki._n <= 1:
            print(
                "Not enough wiki data to plot covariance or time-series similarity. Please use at least two tickers."
            )
        else:
            rho = wiki.get_similarity_matrix()
            print("A time-series similarity measure:")
            print(rho)
            plt.imshow(rho)
            plt.show()

            cov = wiki.get_covariance_matrix()
            print("A covariance matrix:")
            print(cov)
            plt.imshow(cov)
            plt.show()
    else:
        print("No wiki data loaded.")
যদি তুমি চাও, তুমি কালীন সারির ভিত্তিস্বরূপের মধ্যে দেখতে পারোঃ
[8]:
if token != "REPLACE-ME":
    if wiki._data:
        print("The underlying evolution of stock prices:")
        for (cnt, s) in enumerate(stocks):
            plt.plot(wiki._data[cnt], label=s)
        plt.legend()
        plt.xticks(rotation=90)
        plt.show()

        for (cnt, s) in enumerate(stocks):
            print(s)
            print(wiki._data[cnt])
    else:
        print("No wiki data loaded.")
[Optional] সাম্প্রতিক, সূক্ষ্ম-সময়সীমা অ্যাক্সেস করতে টোকেন সেটআপ করুন#
আপনি যদি পেশাদার ডেটা ডাউনলোড করতে চান, তাহলে আপনাকে একটি প্রধান প্রদানকারীর সাথে একটি টোকেন সেট-আপ করতে হবে। আসুন এখন আমরা নাসডাক (NASDAQ) তথ্য চাহিদামাফিক চিত্রিত করি, যা বিড সরবরাহ করতে পারে এবং নির্বিচারে রেজোলিউশনে দাম জিজ্ঞাসা করতে পারে, যেমন সেইসাথে নাসডাক এবং এনওয়াইএসই ইস্যুগুলির জন্য দৈনিক বন্ধের দামের সমষ্টি করতে পারে।
If you don’t have NASDAQ Data on Demand license, you can contact NASDAQ (cf. https://business.nasdaq.com/intel/GIS/Nasdaq-Data-on-Demand.html) to obtain a trial or paid license.
If and when you have access to NASDAQ Data on Demand using your own token, you should replace REPLACE-ME below with the token. To assure the security of the connection, you should also have your own means of validating NASDAQ’s certificates. The DataOnDemandProvider constructor has an optional argument verify, which can be None or a string or a boolean. If it is None, certify certificates will be used (default). If verify is a string, it should be pointing to a certificate for the
HTTPS connection to NASDAQ (dataondemand.nasdaq.com), either in the form of a CA_BUNDLE file or a directory wherein to look.
[9]:
token = "REPLACE-ME"
if token != "REPLACE-ME":
    try:
        nasdaq = DataOnDemandProvider(
            token=token,
            tickers=["GOOG", "AAPL"],
            start=datetime.datetime(2016, 1, 1),
            end=datetime.datetime(2016, 1, 2),
        )
        nasdaq.run()
        for (cnt, s) in enumerate(nasdaq._tickers):
            plt.plot(nasdaq._data[cnt], label=s)
        plt.legend()
        plt.xticks(rotation=90)
        plt.show()
    except QiskitFinanceError as ex:
        print(ex)
        print("Error retrieving data.")
Another major vendor of stock market data is Exchange Data International (EDI), whose API can be used to query over 100 emerging and frontier markets that are Africa, Asia, Far East, Latin America and Middle East, as well as the more established ones. See: https://www.exchange-data.com/ for an overview of the coverage.
The access again requires a valid access token to replace REPLACE-ME below. The token can be obtained on a trial or paid-for basis at: https://data.nasdaq.com/sign-up
[10]:
token = "REPLACE-ME"
if token != "REPLACE-ME":
    try:
        lse = ExchangeDataProvider(
            token=token,
            tickers=["AEO", "ABBY", "ADIG", "ABF", "AEP", "AAL", "AGK", "AFN", "AAS", "AEFS"],
            stockmarket=StockMarket.LONDON,
            start=datetime.datetime(2018, 1, 1),
            end=datetime.datetime(2018, 12, 31),
        )
        lse.run()
        for (cnt, s) in enumerate(lse._tickers):
            plt.plot(lse._data[cnt], label=s)
        plt.legend()
        plt.xticks(rotation=90)
        plt.show()
    except QiskitFinanceError as ex:
        print(ex)
        print("Error retrieving data.")
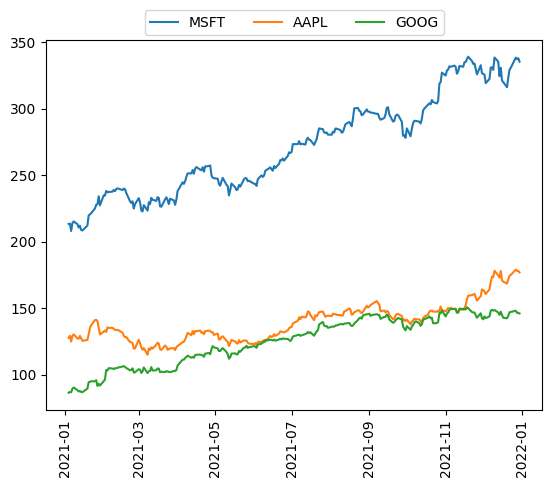
কোনও টোকেন ছাড়াই Yahoo! Finance থেকে যে কোনো Yahoo Finance ডেটা অ্যাক্সেস সম্ভব।
[11]:
try:
    data = YahooDataProvider(
        tickers=["MSFT", "AAPL", "GOOG"],
        start=datetime.datetime(2021, 1, 1),
        end=datetime.datetime(2021, 12, 31),
    )
    data.run()
    for (cnt, s) in enumerate(data._tickers):
        plt.plot(data._data[cnt], label=s)
    plt.legend(loc="upper center", bbox_to_anchor=(0.5, 1.1), ncol=3)
    plt.xticks(rotation=90)
    plt.show()
except QiskitFinanceError as ex:
    data = None
    print(ex)
তথ্যের প্রকৃত ব্যবহারের জন্য, দয়া করে portfolio_optimization বা portfolio_diversification নোটবুকগুলি দেখুন।
[12]:
import qiskit.tools.jupyter

%qiskit_version_table
%qiskit_copyright
Version Information
| Qiskit Software | Version |
|---|---|
qiskit-terra | 0.23.1 |
qiskit-aer | 0.11.2 |
qiskit-ibmq-provider | 0.20.0 |
qiskit | 0.41.0 |
qiskit-finance | 0.4.0 |
qiskit-optimization | 0.5.0 |
qiskit-machine-learning | 0.5.0 |
| System information | |
| Python version | 3.9.10 |
| Python compiler | Clang 13.1.6 (clang-1316.0.21.2.5) |
| Python build | main, Aug 9 2022 18:26:17 |
| OS | Darwin |
| CPUs | 10 |
| Memory (Gb) | 64.0 |
| Thu Feb 16 15:52:54 2023 JST | |
This code is a part of Qiskit
© Copyright IBM 2017, 2023.
This code is licensed under the Apache License, Version 2.0. You may
obtain a copy of this license in the LICENSE.txt file in the root directory
of this source tree or at http://www.apache.org/licenses/LICENSE-2.0.
Any modifications or derivative works of this code must retain this
copyright notice, and modified files need to carry a notice indicating
that they have been altered from the originals.
[ ]: