T2* Ramsey Characterization#
The purpose of the \(T_2^*\) Ramsey experiment is to determine two of the qubit’s
properties: Ramsey or detuning frequency and \(T_2^\ast\). In this experiment,
we would like to get a more precise estimate of the qubit’s frequency given a rough
estimate. The difference between the frequency used for the control rotation pulses and
the qubit transition frequency is called the detuning frequency. This part of the
experiment is called a Ramsey Experiment. \(T_2^\ast\) represents the rate of
decay toward a mixed state, when the qubit is initialized to the
\(\left|1\right\rangle\) state. It is the dephasing time or the transverse
relaxation time of the qubit on the Bloch sphere as a result of both energy relaxation
and pure dephasing in the transverse plane. Unlike \(T_2\), which is measured by
T2Hahn, \(T_2^*\) is sensitive to inhomogenous broadening.
Since the detuning frequency is relatively small, we add a phase gate to the circuit to
enable better measurement. The actual frequency measured is the sum of the detuning
frequency and the user induced oscillation frequency (osc_freq parameter).
import numpy as np
import qiskit
from qiskit_experiments.library import T2Ramsey
The circuits used for the experiment comprise the following steps:
Hadamard gate
Delay
RZ gate that rotates the qubit in the x-y plane
Hadamard gate
Measurement
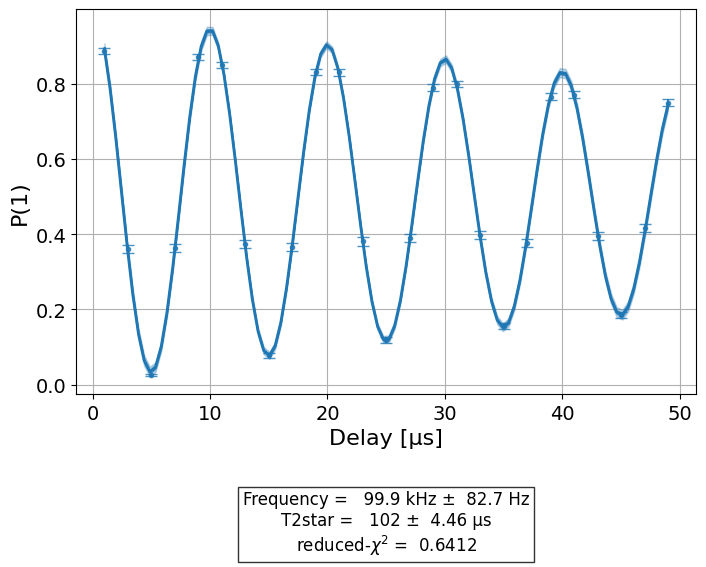
The user provides as input a series of delays (in seconds) and the oscillation frequency (in Hz). During the delay, we expect the qubit to precess about the z-axis. If the p gate and the precession offset each other perfectly, then the qubit will arrive at the \(\left|0\right\rangle\) state (after the second Hadamard gate). By varying the extension of the delays, we get a series of oscillations of the qubit state between the \(\left|0\right\rangle\) and \(\left|1\right\rangle\) states. We can draw the graph of the resulting function, and can analytically extract the desired values.
qubit = 0
# set the desired delays
delays = list(np.arange(1e-6, 50e-6, 2e-6))
# Create a T2Ramsey experiment. Print the first circuit as an example
exp1 = T2Ramsey((qubit,), delays, osc_freq=1e5)

print(exp1.circuits()[0])
     ┌────┐┌─────────────────┐┌─────────┐ ░ ┌────┐ ░ ┌─┐
  q: ┤ √X ├┤ Delay(1e-06[s]) ├┤ Rz(π/5) ├─░─┤ √X ├─░─┤M├
     └────┘└─────────────────┘└─────────┘ ░ └────┘ ░ └╥┘
c: 1/═════════════════════════════════════════════════╩═
                                                      0
We run the experiment on a simulated backend using Qiskit Aer with a pure T1/T2 relaxation noise model.
Note
This tutorial requires the qiskit-aer and qiskit-ibm-runtime
packages to run simulations. You can install them with python -m pip
install qiskit-aer qiskit-ibm-runtime.
# A T1 simulator
from qiskit_ibm_runtime.fake_provider import FakePerth
from qiskit_aer import AerSimulator
from qiskit_aer.noise import NoiseModel

# Create a pure relaxation noise model for AerSimulator
noise_model = NoiseModel.from_backend(
    FakePerth(), thermal_relaxation=True, gate_error=False, readout_error=False
)

# Create a fake backend simulator
backend = AerSimulator.from_backend(FakePerth(), noise_model=noise_model)
The resulting graph will have the form: \(f(t) = a^{-t/T_2*} \cdot \cos(2 \pi f t + \phi) + b\) where t is the delay, \(T_2^\ast\) is the decay factor, and f is the detuning frequency.
# Set scheduling method so circuit is scheduled for delay noise simulation
exp1.set_transpile_options(scheduling_method='asap')

# Run experiment
expdata1 = exp1.run(backend=backend, shots=2000, seed_simulator=101)
expdata1.block_for_results()  # Wait for job/analysis to finish.

# Display the figure
display(expdata1.figure(0))

# Print results
for result in expdata1.analysis_results():
    print(result)
AnalysisResult
- name: @Parameters_T2RamseyAnalysis
- value: CurveFitResult:
 - fitting method: least_squares
 - number of sub-models: 1
  * F_cos_decay(x) = amp * exp(-x / tau) * cos(2 * pi * freq * x + phi) + base
 - success: True
 - number of function evals: 55
 - degree of freedom: 20
 - chi-square: 12.823450300966433
 - reduced chi-square: 0.6411725150483216
 - Akaike info crit.: -6.690006883626211
 - Bayesian info crit.: -0.5956277592852075
 - init params:
  * amp = 0.5
  * tau = 0.0001128424076839831
  * freq = 120071.20598218754
  * phi = -1.5707963267948966
  * base = 0.4766116941529235
 - fit params:
  * amp = 0.491368728646375 ± 0.004916006342544435
  * tau = 0.0001020165082319563 ± 4.464271894146877e-06
  * freq = 99947.5512727167 ± 82.7343978625094
  * phi = 0.004163082478029033 ± 0.012641175702185295
  * base = 0.501137727889661 ± 0.0018216496206444265
 - correlations:
  * (freq, phi) = -0.8232512482515973
  * (amp, tau) = -0.8137656484569767
  * (freq, base) = -0.17127251168225768
  * (amp, freq) = -0.11530229927895952
  * (tau, phi) = -0.1124312557427985
  * (amp, base) = -0.019555140905848853
  * (tau, base) = 0.03653816712062805
  * (tau, freq) = 0.06145064025302784
  * (amp, phi) = 0.16161922673992699
  * (phi, base) = 0.16371035036138787
- quality: good
- extra: <3 items>
- device_components: ['Q0']
- verified: False
AnalysisResult
- name: Frequency
- value: (9.995+/-0.008)e+04
- χ²: 0.6411725150483216
- quality: good
- extra: <3 items>
- device_components: ['Q0']
- verified: False
AnalysisResult
- name: T2star
- value: 0.000102+/-0.000004
- χ²: 0.6411725150483216
- quality: good
- extra: <3 items>
- device_components: ['Q0']
- verified: False
Providing initial user estimates#
The user can provide initial estimates for the parameters to help the
analysis process. Because the curve is expected to decay toward
\(0.5\), the natural choice for parameters \(A\) and \(B\)
is \(0.5\). Varying the value of \(\phi\) will shift the graph
along the x-axis. Since this is not of interest to us, we can safely
initialize \(\phi\) to 0. In this experiment, t2ramsey and f
are the parameters of interest. Good estimates for them are values
computed in previous experiments on this qubit or a similar values
computed for other qubits.
user_p0={
    "A": 0.5,
    "T2star": 20e-6,
    "f": 110000,
    "phi": 0,
    "B": 0.5
        }
exp_with_p0 = T2Ramsey((qubit,), delays, osc_freq=1e5)
exp_with_p0.analysis.set_options(p0=user_p0)
exp_with_p0.set_transpile_options(scheduling_method='asap')
expdata_with_p0 = exp_with_p0.run(backend=backend, shots=2000, seed_simulator=101)
expdata_with_p0.block_for_results()

# Display fit figure
display(expdata_with_p0.figure(0))
# Print results
for result in expdata_with_p0.analysis_results():
    print(result)
AnalysisResult
- name: @Parameters_T2RamseyAnalysis
- value: CurveFitResult:
 - fitting method: least_squares
 - number of sub-models: 1
  * F_cos_decay(x) = amp * exp(-x / tau) * cos(2 * pi * freq * x + phi) + base
 - success: True
 - number of function evals: 74
 - degree of freedom: 20
 - chi-square: 12.823450300967393
 - reduced chi-square: 0.6411725150483696
 - Akaike info crit.: -6.690006883624335
 - Bayesian info crit.: -0.5956277592833317
 - init params:
  * amp = 0.5
  * tau = 0.0001128424076839831
  * freq = 80106.72996087316
  * phi = 0.0
  * base = 0.4766116941529235
 - fit params:
  * amp = 0.49136873033031153 ± 0.004916006360304091
  * tau = 0.0001020165068145614 ± 4.4642717842585194e-06
  * freq = 99947.55117665333 ± 82.7343993349782
  * phi = 0.004163094706704786 ± 0.012641175763416525
  * base = 0.5011377282284685 ± 0.0018216496199839913
 - correlations:
  * (freq, phi) = -0.823251250482674
  * (amp, tau) = -0.8137656489368544
  * (freq, base) = -0.17127251032704133
  * (amp, freq) = -0.11530230066487511
  * (tau, phi) = -0.11243125938387093
  * (amp, base) = -0.019555140018146396
  * (tau, base) = 0.03653816660984814
  * (tau, freq) = 0.061450642595947895
  * (amp, phi) = 0.16161922789886046
  * (phi, base) = 0.16371034794195535
- quality: good
- extra: <3 items>
- device_components: ['Q0']
- verified: False
AnalysisResult
- name: Frequency
- value: (9.995+/-0.008)e+04
- χ²: 0.6411725150483696
- quality: good
- extra: <3 items>
- device_components: ['Q0']
- verified: False
AnalysisResult
- name: T2star
- value: 0.000102+/-0.000004
- χ²: 0.6411725150483696
- quality: good
- extra: <3 items>
- device_components: ['Q0']
- verified: False
See also#
API documentation:
T2Ramsey